DOI: 10.20986/resed.2020.3727/2019
ORIGINAL
Efficacy of pregabalin, gabapentin and duloxetine in neuropathic pain verified by the p-curve analysis
Eficacia de pregabalina, gabapentina y duloxetina en el dolor neuropático verificado por el análisis de la curva-p
J. C. Roche Bueno
Servicio de Neurología. Hospital Universitario Miguel Servet. Zaragoza, España
Received: 21-02-2019
Accepted: 05-11-2019
Correspondence: José Carlos Roche Bueno
jcrochebueno@gmail.com
ABSTRACT
Introduction: There is a growing concern among clinicians and researchers that many results published in scientific journals are false positives.
Objective: To determine the value of evidence or integrity of the body of the published literature on the efficacy of pregabalin, gabapentin and duloxetine in the treatment of neuropathic pain.
Methods: A literature search was conducted selecting randomized clinical trials that evaluated the efficacy of pregabalin, gabapentin and duloxetine in neuropathic pain. The p-curve analysis of the studies with statistically significant results was applied to study their distribution.
Results: It was demonstrated that there was a significant asymmetry to the right in the p-curve of the three drugs (continuous test p <0.0001) confirming the value of evidence from the studies.
Conclusions: Clinicians, scientists and scientific publications should be aware of the growing problem with "p-hacking" and its harmful effects. All parties share the responsibility to maintain the scientific integrity of the published literature.
Key words: P-curve, duloxetine, pregabalin, gabapentin, neuropathic pain, treatment.
RESUMEN
Introducción: Existe una preocupación creciente entre los clínicos y los investigadores de que muchos resultados publicados en revistas científicas se tratan de falsos positivos.
Objetivo: Determinar el valor de evidencia o integridad del cuerpo de la literatura publicada sobre la eficacia de pregabalina, gabapentina y duloxetina en el tratamiento del dolor neuropático.
Métodos: Se realizó una búsqueda bibliográfica seleccionando ensayos clínicos aleatorizados que evaluaban la eficacia de pregabalina, gabapentina y duloxetina en dolor neuropático. Se aplicó el análisis de curva-p de los estudios con resultados estadísticamente significativos para estudiar su distribución.
Resultados: Se demostró que existía una asimetría significativa a la derecha en la curva-p de los tres fármacos (test continuo p < 0,0001) confirmando el valor de evidencia de los estudios.
Conclusiones: Los clínicos, los científicos y las publicaciones científicas deben ser conscientes del problema creciente con el “p-hacking” y sus efectos perjudiciales. Todas las partes comparten la responsabilidad en mantener la integridad científica de la literatura publicada.
Palabras clave: Curva-p, duloxetina, pregabalina, gabapentina, dolor neuropático, tratamiento.
INTRODUCTION
Neuropathic pain is caused by an injury or disease affecting the somatosensory nervous system (1). It involves a considerable impact on the quality of life of patients and an economic burden on society (2-4). Neuropathic pain is considered a specific clinical entity with multiple etiologies (1).
Recent meta-analyses recommend with a strong level of evidence the use of gabapentin, pregabalin, duloxetine, venlafaxine and tricyclic antidepressants as front line therapy for the treatment of neuropathic pain (5). Of the randomized and controlled clinical trials included in this meta-analysis, 7 out of 9 published studies were positive with duloxetine, 9 out of 14 with gabapentin, 4 out of 6 with gabapentin enacarbil and 18 out of 25 with pregabalin. Most of these studies have been performed in patients with painful diabetic neuropathy, postherpetic neuralgia and spinal injuries. However, in real or clinical practice studies the rate of clinical improvement is lower. This may be due to a diagnostic inaccuracy, a relative inefficacy of the drugs or insufficient knowledge on the effectiveness of these drugs.
It should be considered that there is a growing concern among clinicians and researchers that many results published in scientific journals are false positives, that is, type I errors, as in other areas (7) There is evidence that journals, especially those with the highest impact, publish disproportionately significant results (8).
There are two recognized types of publication biases: a) the “file-drawer” effect, which occurs when the researcher tends not to submit his/her findings when they are negative (9); and b) the selective report or “p-hacking”, which occurs when the authors manipulate, intentionally or not, the data through various statistical methods until statistically significant findings are obtained (10,11). Among these incorrect techniques we can include intermediate analyzes in data collection, inclusion or not of outliers, modification of inclusion criteria, multiple comparisons and subgroup analyzes without statistical corrections. The publication of false positives is very detrimental to the advancement of medicine because it leads to the exploration and application of false theories that involve a waste of economic and human resources for researchers, for public administrators with changes in health policy and for patients. Therefore, quantification of selective reports is of vital importance (12).
The p-curve is the distribution of the statistically significant p-values (9). Analyzing its distribution, we can infer whether the findings of the different studies have a value of evidence or not. If the null hypothesis is true (there is no actual effect of the efficacy of the drug we want to study), in 5 % of the conducted studies we would obtain a p-value <0.05, in a 4 % a p-value of <0.04, in a 3 % a p-value of <0.03, and so on. The p-curve would be flat or horizontal. In contrast, if the frequency of the p-values shows an asymmetry towards the right (that is, they are closer to 0.01 than to 0.05), this is an indication of evidence. Conversely, if most of the values are close to the threshold 0.05, we would be faced with a clear example of “p-hacking” or manipulation of results.
The main objective of the study is to analyze the efficacy of pregabalin, duloxetine and gabapentin in the treatment of neuropathic pain by applying the p-curve analysis.
MATERIAL AND METHODS
Search strategy
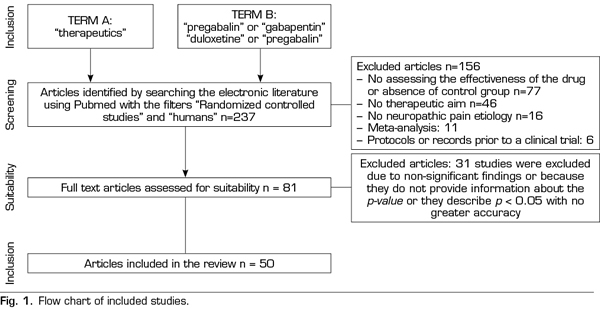
A systematic search was conducted on PubMed, https://www.ncbi.nlm.nih.gov/pubmed/, in October 2018 for terms related to “pregabalin”, “duloxetine”, “gabapentin” and “therapeutics”. The “Randomized Controlled Studies” and “humans” filters were used. Inclusion criteria required the efficacy analysis of one of the target drugs (gabapentin, pregabalin, duloxetine) placebo-controlled in any known etiology of neuropathic pain. A single significant p-value was obtained for each of the studies, the first reported, to avoid correlations between the values of the same study (different doses, different scales studying the degree of pain, etc.). The search retrieved 237 studies, 156 of them were excluded because they did not meet the inclusion criteria (77 did not evaluate the efficacy of the drug or there was no placebo group, 46 did not have a therapeutic purpose as the main objective, 16 did not analyze a known etiology of neuropathic pain, 11 were meta-analyses and 6 were protocols or records prior to a clinical trial). A total of 31 papers of the remaining 81 studies were excluded because no significant findings were found, the p-value was not reported or it was described as p <0.05 with no greater accuracy (Figure 1).
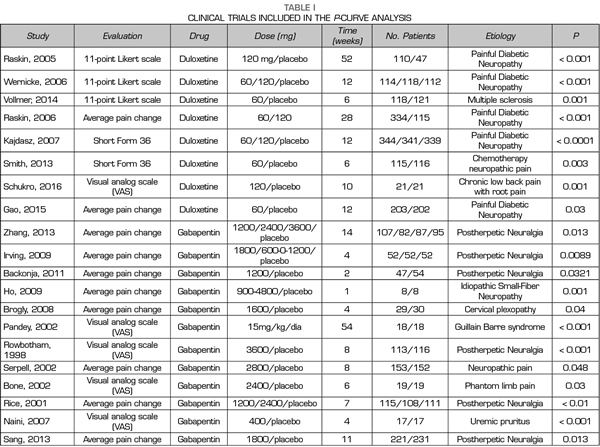
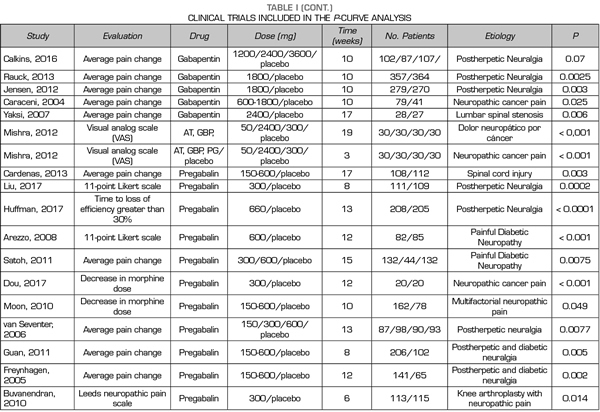
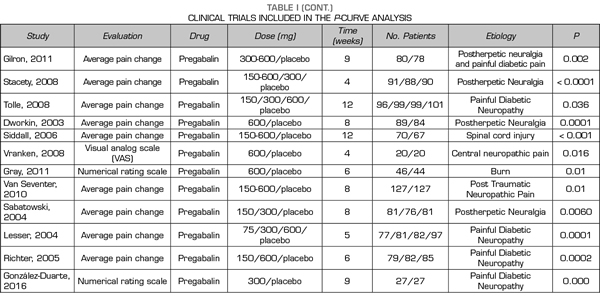
Thus, this analysis of the p-curve comprised the findings of 50 studies investigating the efficacy of pregabalin, duloxetine or gabapentin in the different causes of neuropathic pain (Table I). Values below < 0.0001 were converted to 0.0001. All included studies were published in peer-reviewed journals.
Statistical analysis
The analysis of the p-curve was performed using the free software, http://p-curve.com, based on the theoretical and practical study of Simonsohn et al. (9). This program allows entering the p-values of the original studies, with which it develops two types of statistical analysis: binomial and continuous tests. The binomial tests compare the expected proportion of statistically significant findings that are below p < 0.025 (since all studies published in the medical literature use an alpha value of 0.05) when there is no actual effect assuming 33 % power. Power s defined as the probability of finding a positive finding when it is a true positive. In most clinical trials, a power of around 80 % is usually used, so that 33 % lead to a conservative curve that loosens the expected values. The continuous tests transform the p-values into a Z score, sum the Z scores, divide the result by the square root of the number of p-values included in the analysis, in our study it corresponds to the number of studies, to obtain a mean Z score. This is known as the Stouffer’s method. This mean Z score is compared with the null hypothesis (Z = 0).
With both techniques, binomial test and continuous test, we can determine an asymmetry test on the right to evaluate if the studies contain value of evidence, an asymmetry test on the left to determine if the studies demonstrate an intense “p-hacking”, and a test known as horizontality that determines whether the value of evidence found in the studies is inadequate. The p-curve analysis only uses significant p-values below 0.05.
RESULTS
A total of 9, 18 and 24 out of the 50 studies reporting significant values corresponded to studies conducted with duloxetine, gabapentin and pregabalin, respectively Table I shows the data of the 50 studies included in the analysis, the studied drug and the analyzed p are shown. One of the studies evaluated the efficacy of gabapentin, pregabalin and placebo.
Duloxetine
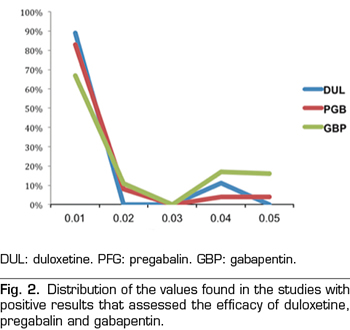
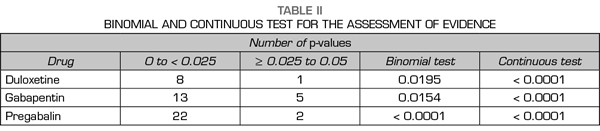
A total of 89 % of the values reported a p-value equal or below 0.01, 0 % reported a p-value of approximately 0.02 or 0.03, 11 % of 0.04 and 0 % of 0.05 (Figure 2). The results indicate that the studies in the analysis contain evidence value indicated by a statistically significant right asymmetry of the p-values with both the binomial test (p = 0.0195) and the continuous test (Z = -5.36, p <0.0001) as shown in Table II. In addition, the distribution did not show asymmetry on the left indicating that there was no “p-hacking”. The horizontality test was not significant for the binomial test (p = 0.9517) nor for the continuous test (Z = 2.89, p = 0.9987). Therefore, the studies do not lack the value of evidence. Finally, the post hoc analysis of statistical power indicates that the average power of the tests included in the p-curve is 83 % with a confidence interval of 58-95 %.
Gabapentin
A total of 67 % of the values reported a p-value equal or below 0.01, 11 % corresponded to a p-value of approximately 0.02, 0 % to a p-value of 0.03, 17 % to a value of 0.04 and 6 % to a value of 0.05 (Figure 2). The results indicate that the studies in the analysis contain a value of evidence indicated by a statistically significant right asymmetry (binomial test, p = 0.0154; continuous test, Z = -5.36, p <0.0001 [Table II]). There was no evidence of “p-hacking.” The horizontality test was not significant (binomial test, p = 0.8014; continuous test, Z = 1.05, p = 0.8526). Studies do not lack the value of evidence. The average power is 50 % with a confidence interval of 24-73 %.
Pregabalin
A total of 83 % of the values reported a value equal or below 0.01, 8 % corresponded to a p-value of approximately 0.02, 0 % to a p-value of 0.03, 4 % to a value of 0.04 and 4 % to a value of 0.05 (Figure 2). The results indicate that the studies in the analysis contain a value of evidence indicated by a statistically significant right asymmetry (binomial test, p <0.0001; continuous test, Z = -7.68, p <0.0001 [Table II]). There was no evidence of “p-hacking.” The horizontality test was not significant (binomial test, p = 0.9967; continuous test, Z = 3.8, p = 0.9999). Studies do not lack the value of evidence. The average power is 77 % with a confidence interval of 61-88 %.
DISCUSSION
The analysis of the p-curve performed in our study suggests that the results of the publications evaluating the therapeutic efficacy of duloxetine, gabapentin and pregabalin compared to placebo in different types of neuropathic pain demonstrate value of evidence as demonstrated by the right asymmetry for each of the examined drugs. The analysis showed no evidence of “p-hacking.” Prior registration of clinical trials with the main aim of the study mitigates the possibility of “p-hacking.” However, the non-publication of studies with negative results makes it difficult to extrapolate the true effect of a drug. In this specific case, it is estimated that the actual efficacy of these drugs could be overestimated by 10 %, taking into account the registered studies that have not been published. Three reviews of the Cochrane Database guarantee efficacy with low to moderate quality for neuropathic pain of duloxetine at doses between 60 and 120 mg/day with a good safety profile compared to other antidepressants or to pregabalin. In these reviews, pregabalin has demonstrated efficacy in most patients with chronic neuropathic pain, with a minority unanswered and with a smaller percentage who will not notice beneficial effects or who will not tolerate side effects. With gabapentin, up to 50 % reduction in pain was obtained that affected the quality of sleep, fatigue, depression and quality of life (5-8). In this way, our results complement these findings confirming that the positive results are true positives, eliminating the doubt of the existence of false positive assumptions or the effects of manipulating the results from the pivotal studies. The study of the p-curve demonstrates the body of quality of the available literature.
When Ronald Fisher introduced the concept of p-value in the 1920s, his intention was not to be a definitive test to judge the evidence on the hypothesis that was to be studied, but a warning that a second look or a confirmatory study was required. Fisher pointed out that the smaller the value of p, the greater the probability that the null hypothesis would be false. However, over the years, obtaining a p-value of 0.05 has become the main objective of many scientific papers and current research medicine has a low rate of study replication (7).
It is necessary to underline that the analysis of the p-curve is different from a meta-analysis, but at the same time it is complementary. Both types of statistical analyzes try to clarify whether a medical effect or intervention is real. A meta-analysis estimates with more strength the actual size of the effect compared to pivotal studies. In contrast, an analysis of the p-curve evaluates the integrity of the findings rather than the magnitude of the effect. It would answer the question of whether positive results reflect publication biases or if they are the result of statistical data manipulation.
The main limitation of the present study is that most of the studies were aimed at populations with painful diabetic polyneuropathy and postherpetic neuralgia, while the other causes of neuropathic pain are not well represented (13-23). For this reason, it is more difficult to extrapolate our data to the different etiologies of neuropathic pain, either central or peripheral.
CONCLUSIONS
Clinicians, scientists and scientific publications should be aware of the growing problem with “p-hacking” and its harmful effects. All stakeholders share responsibility for maintaining the scientific integrity of published literature.
CONFLICTS OF INTEREST
No conflicts of interest or funding sources are declared.
FUNDING
This study has not received funding sources.
REFERENCES